The transformation of the industry and its key risks
2019 is set to be another growth year for the LNG sector. In the changing global energy landscape, as climate change and energy supply diversity become increasingly prevalent, LNG has a key role to play.Globalisation and geopolitics continue to impact and change the energy market, and we can clearly see the influence of each in the transformation of the LNG industry. We aim to answer three questions in this article:
Factors behind the transformation In our view, four key macroeconomic factors have driven rapid LNG industry growth during 2017 and 2018:
First Wave US LNG Projects expected for 2019
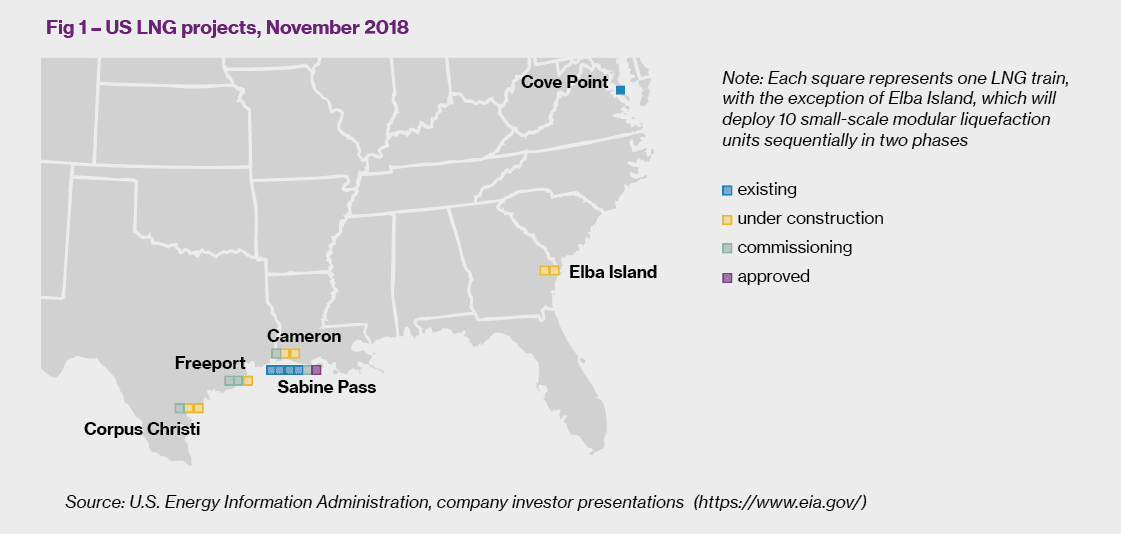
The US shale revolution The long anticipated effects of the US shale revolution are now truly being felt in the LNG sector. Access to plentiful, affordable gas supply has attracted a surge of new investment in LNG production and export infrastructure, centred largely on the Gulf of Mexico in order to access huge natural gas capacity in Texas (see Figure 1 on next page).
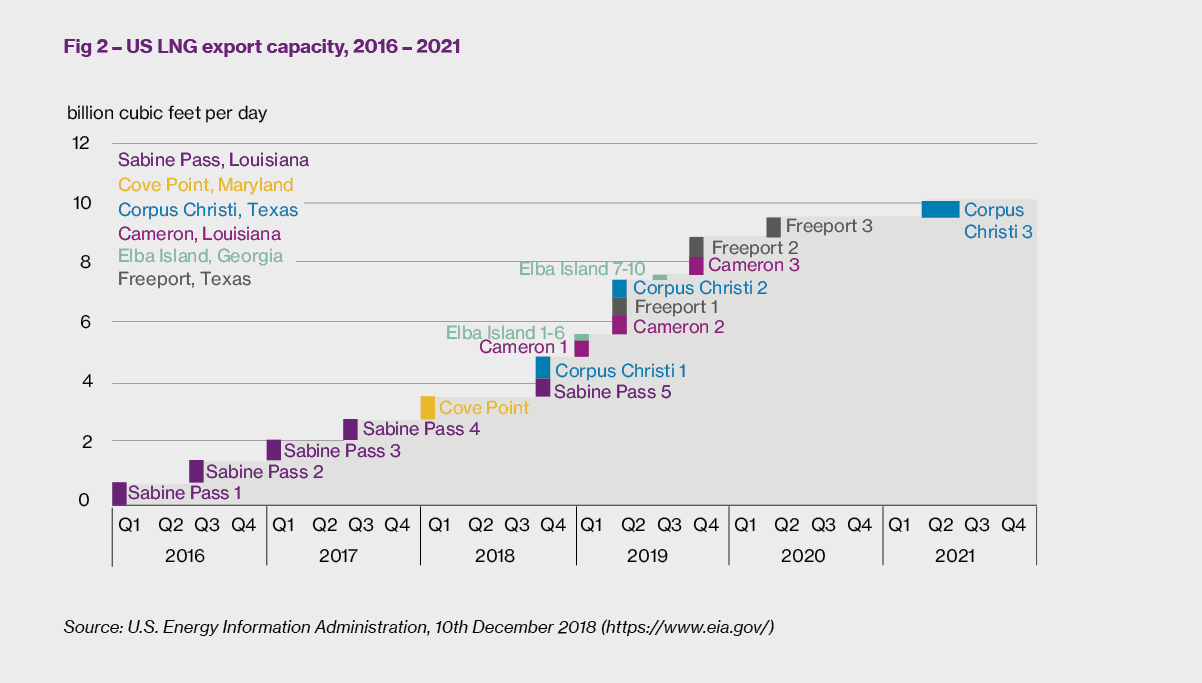
2019 will see a major boost to supply as the first wave of US LNG export projects continue to come online (see Figure 2). The US Energy Information Administration projects that US LNG export capability will have more than doubled by the end of 2019 with an anticipated 8.9 billion cubic feet per day capacity.4 The completion of the first wave of projects will place the US in third place for global LNG export, with Australia in the lead and Qatar second. The US LNG industry has ambitious growth plans, with a second wave of new export projects working towards Final Investment Decisions (FID) in 2019.5 As these projects come to fruition, the global impact of the US shale revolution on gas prices, and therefore LNG, will become very clear.
FID 2019 - likely contenders for approval, US6:
China’s meteoric rise Global demand has been dominated by the effects of China’s economic revolution. Environmental concerns continue to drive a programme to shift the energy source, for both homes and industry, from coal to the more clean burning natural gas. China is currently the world’s second largest importer of LNG after Japan. According to S&P, China ‘will remain the biggest contributor to LNG demand growth’ with the continued implementation of the ‘blue sky’ initiative and Five Year Plan frameworks for environmental planning and improvement7.
The pace of China’s unprecedented LNG demand growth is anticipated to slow. A recent report by China National Petroleum Corporation (CNPC), predicts that China’s gas demand is expected to increase by 11.4% in 2019; a lower growth figure than anticipated8. Investment in the National Development and Reform Commission initiatives to improve South to North pipeline connectivity and storage capacity will eventually help to mitigate its seasonal dependence on LNG, and improve bottlenecks in China’s gas distribution network.
Europe’s European energy reform Whilst overshadowed by China’s presence as an emerging consumer, gas demand has steadily increased in Europe as domestic supply declines9. The lack of accessible, economic European gas sources has underpinned Europe’s progressive dependence on imported LNG. In our view, this is set to accelerate due to the following:
Growth in LNG demand brings with it a web of complex geopolitical issues as the LNG market continues to evolve. World politics are having, and will continue to have, an impact on the distribution of and access to global supply.
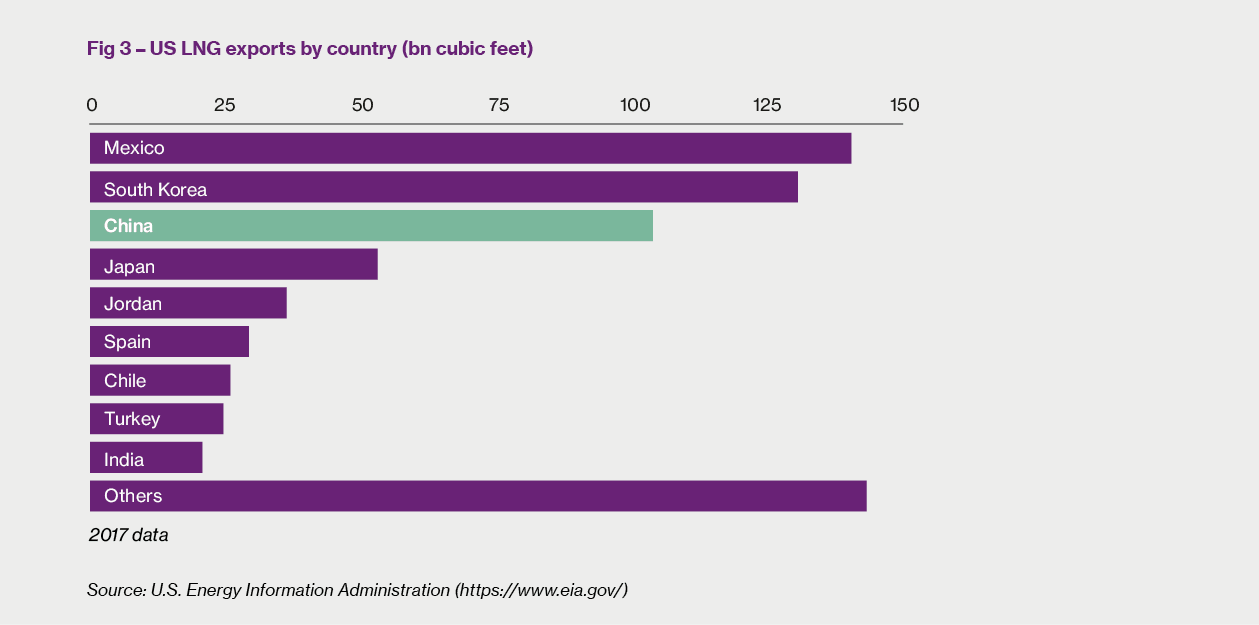
The US/China trade dispute Perhaps the most obvious place to start is the US/China trade dispute. As shown in Figure 3, the US’ third biggest export market in 2017 was China, with further growth a key component for investment in US LNG. Following President Donald Trump’s third round of trade tariffs against China in September 2018, China retaliated with their own levies, including a 10% import tariff on LNG10. Delaying the US tariff increase planned for 1st March 2019 has been a positive step, but whilst uncertainty remains, China looks to alternative suppliers and the US increases pressure on alternative buyers. In the short term, China can utilise Russian supply from Yamal LNG (both CNPC and the Silk Road Fund are partners) and the soon to be operational Power of Siberia pipeline11. Looking further ahead, Russia is planning new capacity to feed the Asia Pacific region. China is said to be interested in investing in Novatek’s US$27 billion Arctic LNG 2 with FID anticipated this year12.
Meanwhile, the US turns to Europe. With the expectation of a major production year for US LNG, President Trump and European Commission President Jean-Claude Juncker agreed in July 2018 to open dialogue with regard to increasing exports to Europe13. The EU’s status as a future US LNG buyer (as an alternative source to Russian pipeline supply) will take time to materialise. The first step comes from Germany in the form of the country’s first LNG import terminal, planned to be located on the Elbe River. Europe is set to play an important role in the absorption of LNG supply as Asian growth stabilises, with European imports expected to double by 2025.
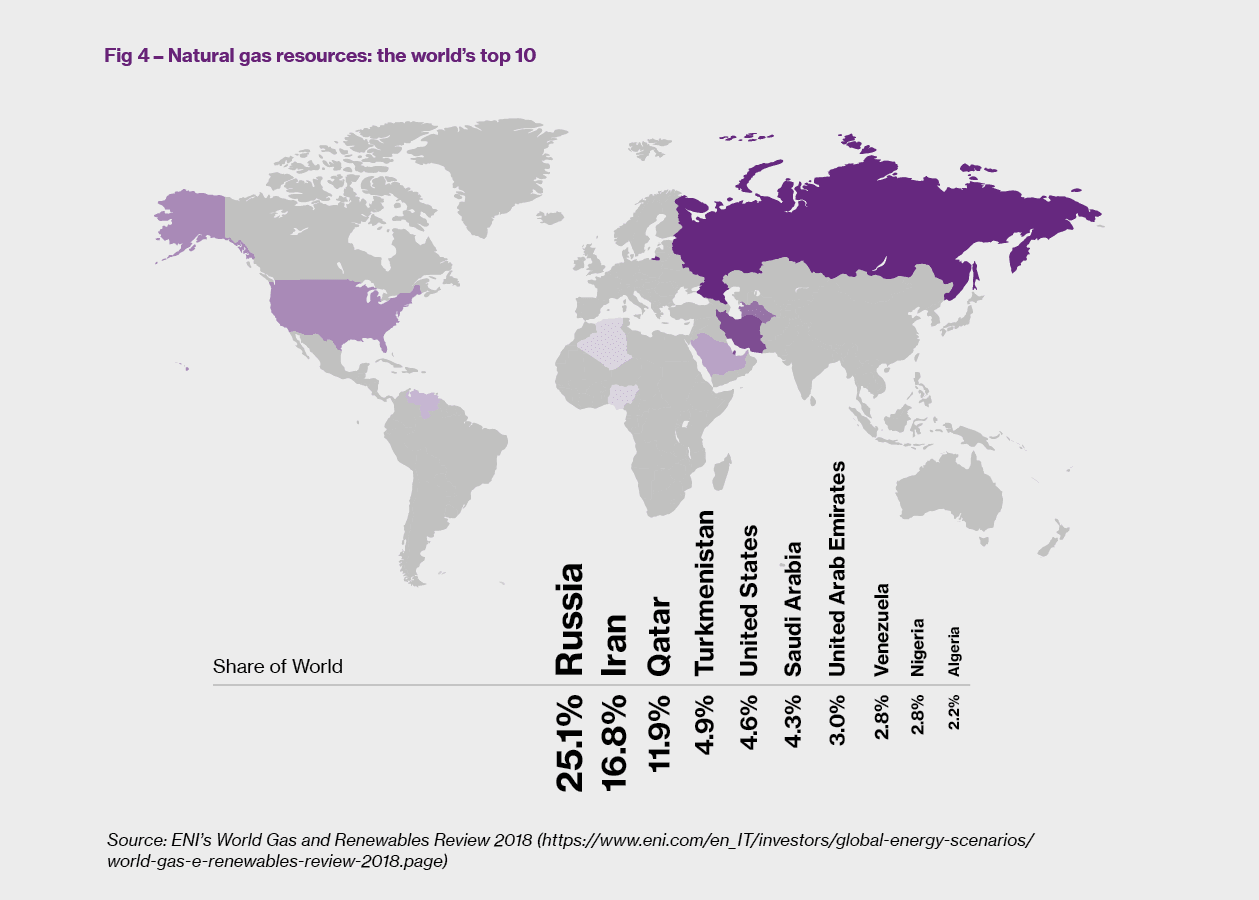
Whilst US LNG is set for a boom year, the US is ranked at fifth place in terms of the world’s top natural gas resources, according to ENI’s World Gas and Renewables Review 201814 (see Figure 4)
The fight for the top In Qatar, aggressive growth targets and an expected wave of new projects are aimed at revitalising their LNG industry and remaining competitive against the US, Australia and Russia15.
After over a decade as the world leader, Qatar has been surpassed by Australia following the start-up of several mega projects16. The evolution of the Australian LNG market has been principally backed by Japan, as the largest buyer. Australia will further increase capacity in 2019, with Shell’s Prelude FLNG (the first offshore floating LNG facility of its kind). The expectation is for Qatar to respond with an investment and expansion surge in order to re-establish its position as the leading global exporter in the 2020s.
Russia: ambitious growth plans As Figure 4 on previous page shows, Russia holds the largest share of proven global gas reserves. Russia has been a later entrant to the LNG game, relying on pipeline exports to Europe, but the success of Novatek’s Yamal LNG project in the Russian Arctic (previously deemed too complex to be viable) marks the start of an ambitious growth plan. Not only has Yamal introduced major new capacity, it has created the Northern Sea Route, halving the shipping time from Northern Russia to Asia compared to the conventional trade route. As predicted by the Nikkei Asian Review: “as more countries gain ground as gas suppliers and emerging economies become bigger consumers, the energy market of tomorrow may look nothing like it did yesterday”.17
We have so far considered market expansion and influencing factors. So how does this affect LNG companies in terms of risk management? Increase in exposure to LNG risks We are seeing an increased number of energy organisations exposed to LNG risks, whether through an active interest in LNG trading, or asset ownership. From a trading perspective, organisations manage entry into new business geographies in line with corporate risk frameworks. This involves assessment of a diverse range of risks: health, safety and environment, regulation, anti-bribery & corruption, people skills and knowledge and supplier risk, alongside the nature of the new business operation. Trading interests often take companies to geographies away from their physical operations, with new territories requiring measurement against company risk strategy and corporate risk parameters. The main risk profile change to a trading company entering a new market will arise from an increased frequency of shipments.
Vessel supplier exposure With increased shipment frequency comes additional exposure to suppliers of vessels, and an amplified liability exposure at LNG terminals. Mechanisms for managing risk exposure involve detailed analysis of supplier selection, contractual liabilities and insurance obligations.
Insurance market appetite LNG is attractive to the insurance markets and underwriter appetite remains strong. With the exception of the two recent construction loss notifications at the onshore component of the Ichthys Project based in Darwin, Australia18, the LNG plant loss record to date has been favourable and risk management, reliability and safety standards have proven to be robust. But the scale of large LNG facilities and concentration of high value assets pose aggregation challenges. Securing the coverage limits that a complex LNG facility requires is not an easy exercise and requires multifaceted placement across global markets. As the insurance market hardens, the operational LNG sector’s generally excellent safety and asset management record will stand it in good stead, as to date the loss experience has proven favourable.
AIG’s Oil and Petrochemicals Leader, Christian Halm, views the key factor when underwriting LNG risks as: “Insured assets [being] managed by experienced operators who have a solid track record and a reputation for striving for world-class excellence in maintenance and loss prevention.” This highlights the need for a close relationship between buyers and their brokers, underwriters and risk engineers. Building a successful partnership between asset owners and the (re)insurance markets ensures effective demonstration of asset quality and risk management. Cautious capacity deployment Capacity deployment is becoming increasingly cautious. Balancing portfolio accumulation and available natural catastrophe coverage is likely to become more problematic as the number of LNG plants increases, assets begin to age and loss ratios become less favourable. Halm further comments that:
“Premium rates have been considerably lower than in any other hydrocarbon processing industries and operators have benefited from premium rate reductions year-on-year. This low loss frequency was a reflection of the generally lower age of the LNG train fleet, as well as the relatively low number of facilities compared to refineries and petrochemical plants.”
The Ichthys construction losses notified in February 2019 are described by the Insurance Insider as being, on a combined basis, “one of the largest claims to hit the insurance market in the last five years [and]… also one of the biggest ever for the Energy Construction market”19. The losses will hit an already tightening construction market and will likely have a knock on effect on Downstream Energy, possibly accelerating anticipated rating and coverage adjustments to insurers’ LNG portfolios.
Ageing assets The majority of LNG facilities are relatively new and have been built to a high standard. As assets age, maintenance and inspection practices are essential in maintaining a good risk record. Industry loss data shows that transient operations (i.e. not normal steady state) represent a much higher risk. The more often the periods of difficult/unusual operations occur, the greater the chances of a mistake or miscalculation, which could lead to a loss of containment. During these operations, unfamiliar operating procedures have to be used and some, such as cool down/warm up activities, can be laborious and may lead to unacceptably high stresses on the equipment and machinery. Additionally, attritional losses are increasing as LNG train fleets age, and components begin to reach their end of life.
Bringing LNG online Several large projects are due to come online in 2019, and with this comes a detailed marketing process to transition insurances from Construction All Risk to Operational.
Demonstrating the testing of key equipment (for example, compressors) at full capacity will be vital to insurers, bearing in mind that risk of equipment failure is increased at higher capacity. Aggregation and capacity need to be carefully managed to avoid over-exposure (or insufficient available capacity) between markets writing both Construction and Operational risk for a major asset. This is particularly relevant to expansion projects. Protecting the revenue stream In addition to high PD values, a large LNG asset will also have very high BI values, given the throughput capacity and anticipated rebuild time. Detailed understanding of the basis of indemnity, any ‘nodes’ representing critical bottlenecks and a comprehensive underwriting submission are essential in achieving an accurate view of the BI loss exposure. Machinery Breakdown is also a significant risk for plants with very large compressor units, which often have at least 18 months lead time on delivery.
In order to mitigate BI and Loss of Production following a compressor breakdown, the ConocoPhillips “two-train-in-one” reliability concept is commonly implemented, allowing operating capacity up to 75% in the event of a compressor failure20. As almost all liquefaction and regasification plants rely on shipping for export, jetty redundancy and port blockage are also major risks for BI. Integrated projects will have further complexities, such as upstream gas production fields, offshore and onshore processing and extended pipeline systems. Influence of Mother Nature Natural Catastrophe (Nat Cat) risk is a key concern with regard to LNG, as import and export facilities tend to be situated at coastal locations (some with inhospitable climates and extreme temperatures).
A topical example is the density of US LNG facilities directly on the hurricane and flood prone Gulf Coast, with all of these facilities (plus other energy related assets in the area) posing high risk exposure to wind storm, storm surge and resultant flooding. Nat Cat coverage in the Gulf of Mexico has long been subject to stringent accumulation constraints with sub-limits well below full policy limit for PD and BI. As the concentration of LNG projects increases, so does the strain on the limited pool of Nat Cat cover available from the insurance markets at an economically feasible price. With lenders requirements key to project viability, risk managers may need to look at Alternative Risk Transfer solutions to manage Nat Cat risk, as insurance capabilities struggle to offer adequate capacity at a practical price to transfer the risk.
The key to the LNG liquefaction process is the refrigeration of the natural gas to below its dew point. This refrigeration is typically provided using a series of refrigeration systems, one of which uses ethylene as the refrigerant. This requires a large inventory of liquid ethylene at the plant.
A common Estimated Maximum Loss (EML) scenario for an LNG facility is a vapour cloud explosion following a release of ethylene from the Ethylene Surge Drum on one of the liquefaction trains. Such a release on a world-scale sized plant would result in between 25 and 30 tonnes of ethylene forming a cloud and then exploding once an ignition source has been found.
Our engineering team advises that the blast radius of such an event would be up to 80% damage at 122 m, 40% damage at 217 m and 5% damage at 344m. Depending on the spacing between the liquefaction trains, this is normally large enough to cause extensive damage to one train and any train adjacent to it. Spacing is therefore crucial in determining a facility’s EML, which for insurance purposes can reach over US$1 billion for a major liquefaction facility.
The Machinery Breakdown EML is typically associated with one of the large compressors that run the refrigeration loops. These machines can have a replacement value of approximately US$100 million and, when they are not operating, can impact production depending on the amount of flexibility and machinery sparing the plant has.
Conclusion: reflections on the future of LNG As observed by Harry Booth of Markel International’s Energy team:
“Sustainable development means achieving a balance between environmental, social and economic dimensions, and natural gas can offer a solution.”
At the moment, as an energy source LNG strikes an attractive balance between these three factors and access to resource is becoming easier. With the cost cycle at its lowest point, a surge of investment and planning will seek to meet increasing global demand.
Clouds on the horizon? Speculation with regard to LNG market over-capacity is already present. This, in accordance with other factors outlined earlier, is leading to theory that there may be future reluctance to embark on new projects or to sign long term contracts. The US LNG boom has sparked a trend towards short term contracts or gas-on-gas contracts based on spot pricing (rather than oil) in order to take advantage of further decline in pricing. With long term contracts key to securing FID for new projects, prospective US LNG exporters will be awaiting a resolution to the US and China trade disputes. New frontiers With over-supply predicted, emerging markets are set to play an increasingly important role as traditional markets saturate. As LNG supply starts to exceed growth demand, pricing is likely to be forced downwards on both LNG and pipe imports. Whilst the market focus for the moment concentrates on US LNG, Figure 5 illustrates the range of territories, all with differing risks, in the pipeline for both expansions and new facilities:
Market movements and emerging risks will need to be carefully managed as Risk Managers develop their own mitigation strategies in these uncertain times. In our view, the key emerging risks to consider in the near future will be:
We believe that these five areas of focus will be fundamental in the development of robust risk management strategies for LNG companies. When risk managers and their intermediaries work together to determine the most appropriate responses to these challenges, the industry can look forward to its future with confidence.
Linda Saunders is a Client Relationship Manager at Willis Towers Watson Natural Resources in London.
1 https://uk.reuters.com/article/lng-outlook/record-lng-capacity-to-get-green-light-in-2019-amid-strong-demand-idUKL3N1Z21KH 2 http://freeportlng.com/our-business/gas-liquefaction/ 3 https://www.lngworldnews.com/us-elba-island-lng-export-project-pushed-back/ 4 https://www.aa.com.tr/en/energy/general/us-lng-export-capacity-to-more-than-double-by-end-2019/22681 5 https://www.woodmac.com/press-releases/golden-pass-lng-fid/ 6 https://www.woodmac.com/press-releases/golden-pass-lng-fid/ 7 S&P Global, Platts Analytics, 30th January 2019 8 https://www.reuters.com/article/us-china-cnpc-oil/china-crude-output-seen-flat-in-2019-gas-demand-to-climb-cnpc-idUSKCN1PA0MZ 9 https://atradius.co.uk/reports/european-gas-market-outlook-2018.html 10 https://www.bloomberg.com/news/articles/2018-09-17/trump-ratchets-up-tariff-pressure-on-china-with-200-billion-hit 11 http://www.gazprom.com/press/news/reports/2017/time-records/ 12 https://oilprice.com/Energy/Energy-General/Russias-Looks-To-Build-LNG-Island-To-Supply-Booming-Asian-Market.html 13 https://www.theguardian.com/business/live/2018/jul/25/trump-juncker-trade-talks-tariffs-cars-business-live 14 https://www.eni.com/en_IT/investors/global-energy-scenarios/world-gas-e-renewables-review-2018.page 15 https://www.reuters.com/article/us-qatar-lng/qatar-signals-lng-price-war-for-market-share-in-asia-idUSKBN19Q0YX 16 https://www.reuters.com/article/us-australia-qatar-lng/australia-grabs-worlds-biggest-lng-exporter-crown-from-qatar-in-nov-idUSKBN1O907N 17 https://asia.nikkei.com/ 18 https://www.insidefac.com/articles/125028/ichthys-lng-project-threatens-14bn-construction-loss 19 Energy construction market braces for $1.4bn Ichthys losses” Insurance Insider, 22 February 2019 20 https://eprints.usq.edu.au/27901/12/Deo_2014_whole.pdf